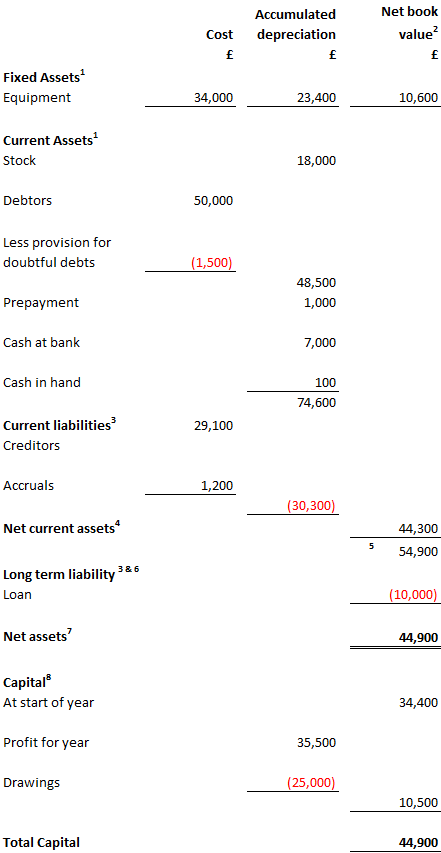
Below is an example of a balance sheet for the fictitious company ABC Trading, together with notes about it.
Notes for the Balance Sheet
The Balance Sheet is in two parts. The top part shows all the liability accounts being deducted from all the asset accounts. The bottom part shows all the capital accounts of the business (i.e. money invested in the business) and importantly, includes the final profit figure from the Profit and Loss Account.
- A distinction is made between ‘fixed’ assets and ‘current’ assets. ‘Fixed’ assets are held in the business long-term, such as land and buildings, machinery, etc. ‘Current’ assets come and go in the short term: a ‘current’ asset is one which is likely to be converted into cash within one year (e.g. when a debtor pays his bill).
- The fixed assets of the business are set out at the top of the Balance Sheet. You will note that a horizontal format is used here, showing depreciation of these assets (the decline in their value since purchase). The Net Book Value figure (£10,600) in the right hand column represents the cost of acquiring the asset less depreciation. It is this figure that is used in calculating the Net Asset Value (‘NAV’) of the business.
- Liabilities are categorised in a similar way to assets, as either ‘current’ or ‘long term’. ‘Current’ liabilities are due to be paid within one year, ‘long term’ liabilities after at least a year.
- A sub-calculation is now performed to show the ‘Net Current Assets’ of the business. This figure is calculated by deducting all current liabilities from all current assets (i.e. ignoring fixed assets and long-term liabilities). The Net Current Asset figure (£44,300 in this example) is shown in the right hand column and is used in calculating the NAV. Net Current Assets is an important figure as it gives an indication of how much cash the business could make available at short notice. Even if a business has a high NAV, if most of its value is tied up in fixed assets it might not be attractive to a potential creditor because it might not have sufficient ready cash to pay bills.
- Net Current Assets is now added to Net Book Value of the fixed assets (totalling £54,900 in this example).
- The last sub-category of accounts to appear in the top half of the Balance Sheet is long-term liabilities. These are often loans which are not repayable at a time which is more than a year in the future. The total amount of these long-term liabilities (£10,000 in this example) is set out in the right hand column and is used in calculating the NAV.
- You can see the final calculation for the top half of the Balance Sheet by reading down the right hand column. The calculation in this example is:
FIXED ASSETS (NET BOOK VALUE) 10,600
+ NET CURRENT ASSETS          44,300
– LONG TERM LIABILITIES      (10,000)
= NET ASSETS 44,900 - The bottom part of the Balance Sheet shows the funds that have been invested in the business to achieve the total Net Assets. The capital figure represents money contributed by the owners and/or an accumulation of profits from previous accounting periods. The profit figure is the final figure taken from the Profit and Loss Account for the current accounting period. The drawings are withdrawals of capital from the business by the owners and are therefore shown as a deduction.