Consolidated accounts

Companies with one or more subsidiaries are required to publish accounts for the group of companies as a whole as well as their own annual accounts (s.399 CA 2006). This is because (subject to certain exemptions) shareholders of the parent company should have access to some information regarding the subsidiary company. In principle, every subsidiary in the group also has a duty to prepare its own individual accounts, but exemptions are widely available so it is likely to be rare in practice for subsidiaries to do so (ss.394A and 479A CA 2006).

In this post, I discuss the concept of consolidated accounts at a high level, without considering the rules in any detail.

The consolidated Profit and Loss Account

In consolidated accounts, the Profit and Loss Account of the parent company and its subsidiaries are brought together (see the third column in the example below).

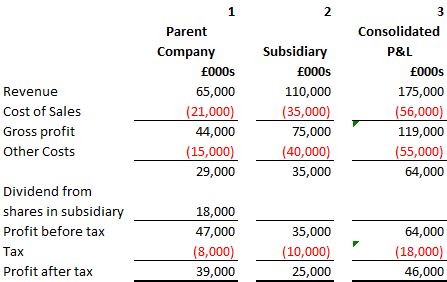
The Profit and Loss Account of the parent company (column 1 above) will include dividends paid to it by the subsidiary but not the subsidiary’s profits. Such dividends and any intra group trading that has taken place between the subsidiary and the parent company are excluded from the consolidated Profit and Loss Account (column 3 above).

There is one further factor to consider if the subsidiary is not wholly owned (i.e. if there is a third-party minority interest in the subsidiary). In this scenario, the entire profit for the parent company and its subsidiaries will be shown in the group accounts – then the minority interest’s share is deducted.

The consolidated Balance Sheet

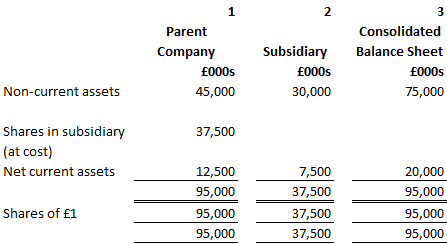
The Balance Sheets of each company in the group will be amalgamated and the only issued share capital represented on the consolidated Balance Sheet (column 3) will be that of the parent company.

The Balance Sheet of the parent company will include the share capital of the subsidiary as a long-term investment, at cost. The subsidiary in this example has no subsidiary of its own and so shows no long term investment in its Balance Sheet (Column 2).

The assets of the subsidiary must however be added to the assets of the parent and represented in the consolidated Balance Sheet accordingly. After a subsidiary has been acquired, its profits are included in the consolidated Profit and Loss Account.

What if the subsidiary is not wholly owned? The total assets and liabilities of the companies in the group are shown, along with the minority interest’s share in those assets and liabilities as a deduction.

Balance Sheet example

Below is an example of a balance sheet for the fictitious company ABC Trading, together with notes about it.

Notes for the Balance Sheet
The Balance Sheet is in two parts. The top part shows all the liability accounts being deducted from all the asset accounts. The bottom part shows all the capital accounts of the business (i.e. money invested in the business) and importantly, includes the final profit figure from the Profit and Loss Account.

  1. A distinction is made between ‘fixed’ assets and ‘current’ assets. ‘Fixed’ assets are held in the business long-term, such as land and buildings, machinery, etc. ‘Current’ assets come and go in the short term: a ‘current’ asset is one which is likely to be converted into cash within one year (e.g. when a debtor pays his bill).
  2. The fixed assets of the business are set out at the top of the Balance Sheet. You will note that a horizontal format is used here, showing depreciation of these assets (the decline in their value since purchase). The Net Book Value figure (£10,600) in the right hand column represents the cost of acquiring the asset less depreciation. It is this figure that is used in calculating the Net Asset Value (‘NAV’) of the business.
  3. Liabilities are categorised in a similar way to assets, as either ‘current’ or ‘long term’. ‘Current’ liabilities are due to be paid within one year, ‘long term’ liabilities after at least a year.
  4. A sub-calculation is now performed to show the ‘Net Current Assets’ of the business. This figure is calculated by deducting all current liabilities from all current assets (i.e. ignoring fixed assets and long-term liabilities). The Net Current Asset figure (£44,300 in this example) is shown in the right hand column and is used in calculating the NAV. Net Current Assets is an important figure as it gives an indication of how much cash the business could make available at short notice. Even if a business has a high NAV, if most of its value is tied up in fixed assets it might not be attractive to a potential creditor because it might not have sufficient ready cash to pay bills.
  5. Net Current Assets is now added to Net Book Value of the fixed assets (totalling £54,900 in this example).
  6. The last sub-category of accounts to appear in the top half of the Balance Sheet is long-term liabilities. These are often loans which are not repayable at a time which is more than a year in the future. The total amount of these long-term liabilities (£10,000 in this example) is set out in the right hand column and is used in calculating the NAV.
  7. You can see the final calculation for the top half of the Balance Sheet by reading down the right hand column. The calculation in this example is:
    FIXED ASSETS (NET BOOK VALUE) 10,600
    + NET CURRENT ASSETS 44,300
    – LONG TERM LIABILITIES (10,000)
    = NET ASSETS 44,900
  8. The bottom part of the Balance Sheet shows the funds that have been invested in the business to achieve the total Net Assets. The capital figure represents money contributed by the owners and/or an accumulation of profits from previous accounting periods. The profit figure is the final figure taken from the Profit and Loss Account for the current accounting period. The drawings are withdrawals of capital from the business by the owners and are therefore shown as a deduction.

The Balance Sheet

Having produced the profit and loss account for the period, it is now possible to prepare a Balance Sheet for the period. On its own, the Profit and Loss Account is an incomplete record of a business’s financial position as it only records two income and expenses. The Balance Sheet will record the situation of the business in respect of asset, liability and capital accounts from the trial balance.

The Balance Sheet differs from the Profit and Loss Account as it is a snapshot that is only relevant on a given date. The date at the top of a Balance Sheet is the last day of the accounting period to which it relates. The heading of a balance sheet always contains the words “as at” a specified date. That balance could be different the very next day, if for example, an asset was sold and the proceeds used to pay bills.

The Balance Sheet principally indicates:

  • the net worth or net asset value (‘NAV’) of the particular business (i.e. the value of the assets it has, less the liabilities it owes). This is recorded in the top half of the Balance Sheet; and
  • the capital invested in the business to achieve that net worth. This is recorded in the bottom half of the Balance Sheet.

These figures will always be the same, unless something has gone wrong. The two halves of the Balance Sheet must always ‘balance’. This ‘balancing effect’ is because the top half of the Balance Sheet demonstrates how the money invested by the owners of the business has been used.

As a general rule, asset, liability and capital entries from the trial balance are transferred into the Balance Sheet. For example, ‘debtors’ in the trial balance is an asset and this appears in the top half of the Balance Sheet. Compare this to ‘capital at the start of the year’, which is a capital entry and appears in the bottom half of the Balance Sheet.

In my next post, I will present an example of a Balance Sheet, together with notes regarding it.